Chainlink Insights: an analysis of Oracle's revenue and performance
Intro
Everyone is always looking for ways to improve their finances and we often hear that staking in crypto can't be profitable and stable during the bear market. At P2P we think that it depends on how effectively your staking provider uses the infrastructure.
Today we want to share the story of how we became a successful Node operator (NOP) on Chainlink by continuously improving our performance metrics. We will also talk about Chainlink’s oracle network, its current state and how NOPs can get a stable revenue even during a bear market.
What is Chainlink oracle network?
Chainlink is the market-leading decentralised oracle network providing real-world data to smart contracts on any blockchain. Currently, Chainlink supplies data for DeFi consumers across 14 networks:
Ethereum registered the highest number of working oracles during 2022.
Within each network, oracles can provide different types of data:
price rates between two tokens, NFTs, etc. (data about the price relation between 2 tokens is called data feeds);
automation services;
direct requests from consumers (when somebody directly requests data from Chainlink protocol);
A verifiable source of randomness for smart contract developers (VFR).
P2P currently provides more than 2000 unique data feeds on different chains. While most of these data feeds are shared across multiple chains, some of them are unique to a specific chain, for example, the METIS-USD data feed is present only in the Metis network. Here’s the distribution of data feeds per network:
These data feeds are distributed between node operators in every blockchain. This is the first side of Chainlink’s decentralisation.
A few technical details:
Oracles generate reports for data feeds continuously by sending requests to data providers (APIs) and aggregating them (median). Every time consumers need data, Chainlink asks one of the oracles, that is assigned to that data feed, to write that data to the blockchain. The session data recording is called the Round and the chosen oracle is called the Leader of the Round. The Leader gets data from other oracles (who are also assigned to this data feed), calculates the median value and writes it to the blockchain. If for any reason the Leader couldn’t do it - the next oracle becomes the Leader and has to do it.
It is not enough to just attract a large number of oracles, it is also important to ensure that the oracle’s data is decentralised. This is achieved by using different data sources for different oracles.
For example, the price feed for ETH-USD in Fantom is distributed between oracles and data sources (APIs) as follows:
Note: A 1 means that an oracle gets the data from the API, 0 means that the oracle doesn’t get it from that source
The degree of decentralisation can vary as it depends on the number of data sources that provide the price data and the number of oracles. We only need the fact that different oracles send requests to different API services to proceed with the data when Chainlink needs it for understanding Chainlink’s decentralisation.
P2P & Chainlink
P2P joined the Chainlink oracles network in 2018. We first started as a NOP in Ethereum on several data feeds and we haven't stopped growing since that time. Today we are present in 6 networks and we provide data for more than 150 feeds.
This level of growth was a serious challenge for us as a company. Looking back it seems that it would be impossible to become a successful Node operator without a data-driven approach. Luckily, in 2020 we had already understood that we needed to collect and analyse data about NOPs’ performance in Chainlink. In this article we will walk you through our path and go through it from the beginning.
We provide 4 steps for a successful data-driven approach to node management:
Define key metrics. You can’t control anything without measuring it, but first, you need to understand what you want to measure.
Extract all the necessary data. It seems obvious but we had to work hard to collect all the data from different networks, make indexers and transform it so that they are usable for analytical purposes.
Determine who is a good node operator. When you’ve collected all the metrics you should understand what you can do with them: what is under your control and what is not. You need to also keep in mind Chainlink's main mission - to provide accurate off-chain data to the blockchains.
Decision making. Develop analytic tools to transform the data into knowledge that can be used in decision-making.
Let's start with the first step.
Key metrics
The main purpose of the Chainlink protocol is to provide data for users. As we have previously mentioned, “Round” is the act of writing data to the blockchain by an Oracle.
Here are the number of rounds for the Ethereum mainnet in 2022.
This is how we compare the consumption of Chainlink’s data by different chains (for example Avalanche, Fantom, Harmony, Moonriver and Ethereum). You can notice there is a peak in the number of rounds in May (Terra collapse), June (Celsius) and November (FTT/FTX collapse). This is true for every chain:
We can track the number of rounds to measure the consumption of data supported by Chainlink for any chain/feed/oracle. For example here is the number of rounds for ETH-USD (dark blue), FTT-USD (green) and ATOM-USD (bright blue) on Ethereum’s mainnet:
There are a lot of spikes for the ETH-USD data feed. During our monitoring of Chainlink's activity, we see that every significant crypto event increases the demand for ETH data feeds. It is probably connected with the need to swap every token to Ethereum either because it seems like one of the most securable assets or because it has the best liquidity;
Cosmos ATOM saw a growing demand for price data in the middle of May (we link this with the Terra collapse) and not a so significant peak in November;
With FTT we see the opposite. The number of rounds was lower during May ‘22 and much bigger in November ‘22 during the FTX scandal.
It is not enough to just provide data, our purpose in Chainlink as a NOP is to provide accurate data. For that, we need an estimation of the quality of the data that is calculated based on the oracles’ answers every round. We call this “Deviation”. It is calculated by comparing a particular oracle’s answer for that Round to the Round’s final value (the median of each oracle's answer). This way, we can track the variance of each oracle every Round. This can also be used to calculate the average value of each oracle’s deviation. Here is how we can compare the data quality for different chains:
It is important to mention that the most popular deviation threshold for data feed defined by Chainlink is 0.5%. There are a lot of feeds with even a 5% deviation threshold.
It is also interesting to compare the performance of different NOPs by their ability to write Chainlink data on-chain. We use the Transaction success rate (TSR) for this. This is the ratio of the number of successful transactions to the number of unsuccessful transactions.
Data extraction
This is not the main subject of the current article. We plan to talk about this a bit more in a future post. Today we will only mention the main architecture of the ETL (Extract, transform, load steps of data uploading pipeline) process:
Stay tuned if you want to know more about data and indexation in the future.
Who is a good node operator?
Every NOP is a company first. The main target of every business is to be profitable. Let’s look deeper into Node operator economics.
Oracles get rewarded in LINK for every report to the blockchain, regardless of who was the Leader of the round. The Leader gets additional rewards for writing data to the blockchain.
The main expenses of an Oracle are gas costs, infrastructure costs and human resources. Oracles should pay the gas cost to write data to the blockchain when it was chosen as Leader of the Round.
We can track rewards and gas costs to estimate the revenue of the oracle's performance. Here is Chainlink on Ethereum financial metrics:
So the total net revenue for all of the oracles in Ethereum is 37.3 mil $ during this year.
Now we know the Chainlink mechanics. We also know that a Bear market in Crypto leads to smaller amounts of revenue for every project. But 2022 has also brought us a lot of activity from scandals involving multiple projects: Terra, Celsius, FTT and so on. What if we want to understand how stable an oracle’s revenue can be during an unusual event ? We will definitely want to know what the gas spending value was and how many rewards the oracles got. It will also be great to see deviations to understand the consensus about price data between oracles.
Let’s see what was happening with an oracle's net revenue during 2022 across 6 networks: Ethereum, Solana, Fantom, Moonriver, Harmony and Avalanche:
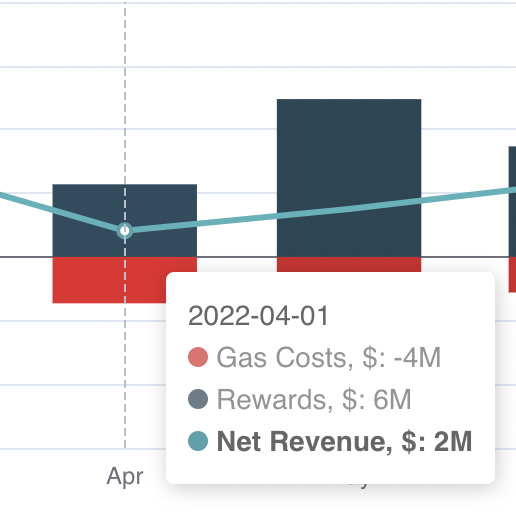
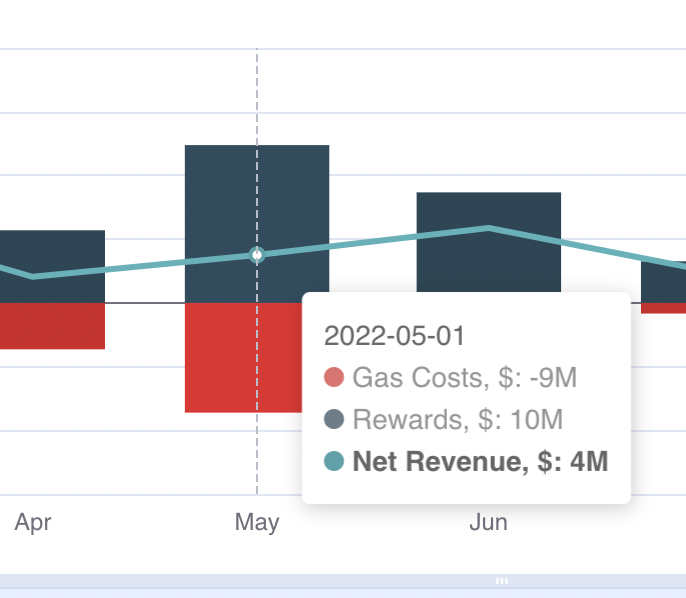
Here's what was happening with revenue during April-may ‘22 to understand how the Terra event influenced Chainlink NOPs:
We can see that everything went up: Costs, Rewards and Net Revenue. So during this commotion around Terra, we see a peak in the number of rounds as we mentioned earlier. It led to an increase in network utilisation and higher gas costs. But it also brought more rewards to node operators and higher Net Revenue as a result.
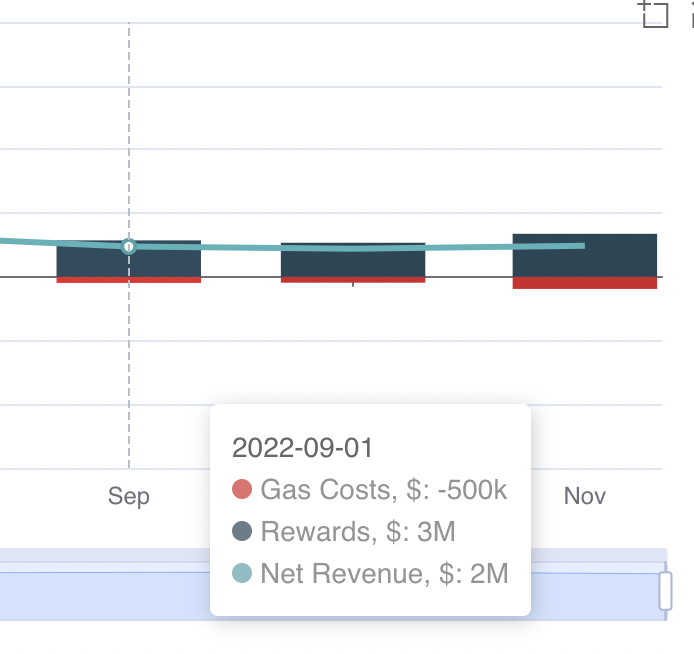
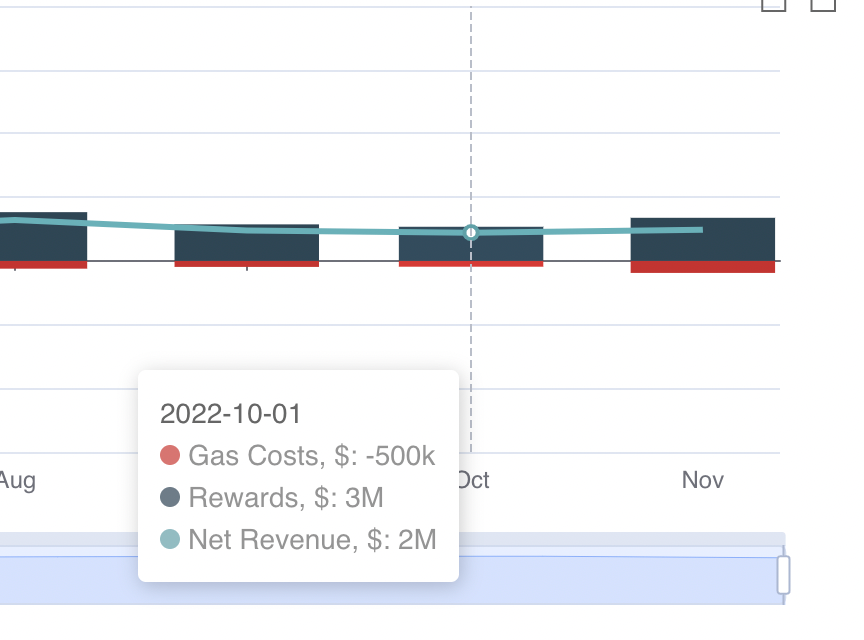
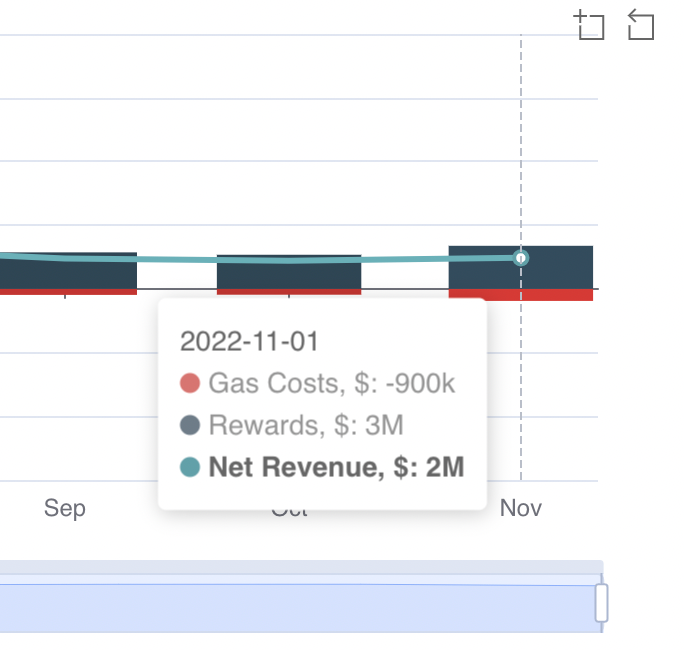
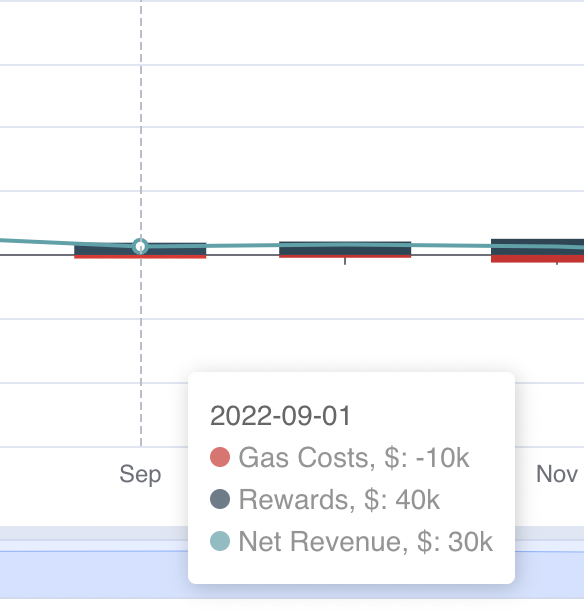
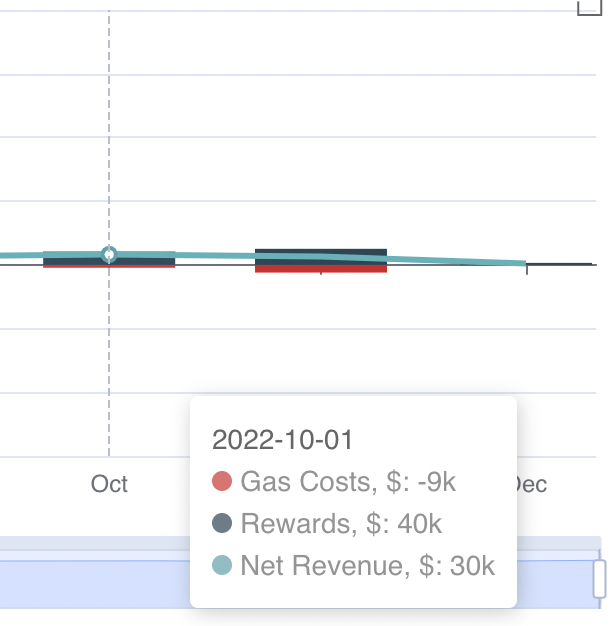
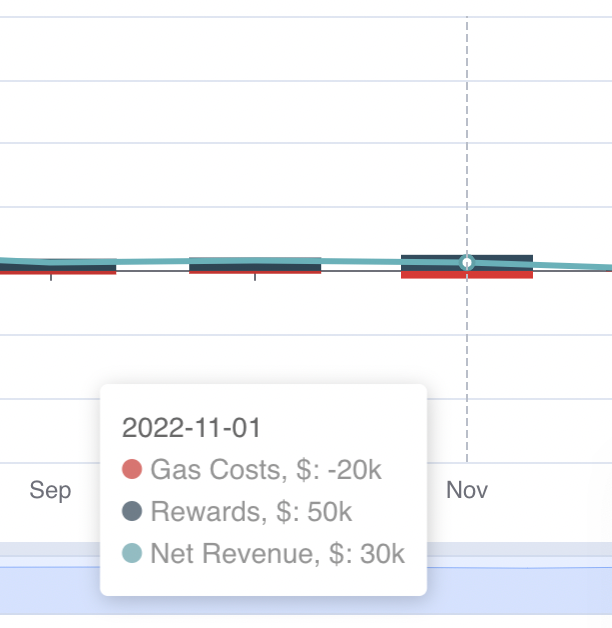
A slightly different situation was the FTT/FTX collapse. We’ve already seen that there were way more rounds for FTT data feeds. If we dig deeper we can also see that it happened to every asset associated with FTX such as Solana. But what about net revenue?
It was the same during September and October, with no significant differences. But what about P2P:
Our revenue hasn't changed much during the last 3 months.
Besides revenue, every NOP should care about its reputation in the Chainlink network. As we previously mentioned, we track reputation by 2 key metrics:
Deviation
TSR
Here’s the Deviation stat for 5 networks:
The two red vertical lines mark the Terra and FTT/FTX events.
It is expected that during a big market event, the consistency of oracles decreases. We can see the huge deviation in Avalanche and Moonriver during the Terra collapse.
During the FTX event we can observe a deviation, although much smaller when compared to the earlier one:
We can also compare oracles based on TSR to estimate how successful oracles are in writing data to the blockchain. For example, here is the TSR for Ethereum’s mainnet:
We can observe that during November and for most of 2022, P2P had a TSR ranging between 90-100% in every network except Fantom and Solana (and Moonriver in April). This is because those chains use a different transaction execution mechanism compared to most EVM chains. You can make sure that this is quite a good metric value by comparing us to others.
Here is the distribution of different NOPs TSR for the Fantom network:
We can observe that even at its lowest point P2P was among the top NOPs.
The median TSR or all Nops on Solana was 6.07% and the median TSR for P2P was 6% for the same period.
Decision making
In this section, we will discuss how we solve business problems by using a data-driven approach.
On August 2021 Ethereum released EIP-1559. A significant aspect of this proposal was how it overhauled the transaction fee system. For P2P it meant that we could now use EIP-1559 to prioritize transactions. We weren’t sure how this would affect the transaction success rate, in other words, did miners have a preference for one type of transaction?
We’ve decided to run an A/B test. The design was to switch the priority fee algorithm from Standard to 1559 every 15 minutes and set the configuration of both algorithms. As a result, we’ve got the same transaction success rate and significantly different cap fees as can be seen in the picture below:
This is how data analysis and data-driven approaches are applied in decision-making.
Staking
Chainlink Staking v.0.1 launched on December 6, 2022. During this first version there are two ways to stake Chainlink:
Community staking: you need to satisfy three criteria and the APR is around 4.75%
Staking through a NOP: when a NOP stakes from 1000 to 50k LINKs as a self-stake. APR is 7%.
If you want to see the details you can read this post in our blog or on Chainlink's official website. But as you may see the community staking pool is already full and won’t be expended till v.1.0 (9-12 months):
That is why we are glad to provide our clients with a custodial solution to get a higher APR through P2P with a 10% fee. Through P2P you need a minimum of 10k LINK and can stake up to 50k LINK.
About P2P
P2P Validator is a world-leading staking provider with the best industry security practices and proven expertise. We provide comprehensive due diligence on digital assets and offer only top-notch staking opportunities. At the time of the latest update, more than 1,5 billion USD is staked with P2P Validator by over 25,000 delegators across 25+ networks.
Subscribe to P2P-economy
Get the latest posts delivered right to your inbox
<!--kg-card-begin: markdown--><h3 id="table-of-contents">Table of Contents</h3>
<ul>
<li><a href="#T1"><span style=" font-size:16px"> What is Ethereum (ETH) Staking? </span></a></li>
<li><a href="#T2"><span style=" font-size:16px"> Why stake Ethereum (ETH) with P2P? </span></a></li>
<li><a href="#T3"><span style=" font-size:16px"> What does the Ethereum (ETH) staking process look like?<br>
</span></a></li>
<li><a href="#T4"><span style=" font-size:16px"> Ethereum (ETH) staking guide </span></a></li>
<li><a href="#T5"><span style=" font-size:16px"> P2P Ethereum (ETH) Staking FAQ </span></a></li>
</ul>
<h2 id="what-is-ethereum-eth-staking-a-namet1a">What is Ethereum (ETH) Staking? <a name="T1"></a></h2>
<p>When staking Ethereum (ETH) we are supporting the network with the additional benefit of earning additional ETH! Ethereum uses “Proof-of-stake” (PoS) as a consensus mechanism, where validators are responsible for reaching a consensus on adding new transaction blocks to the blockchain.</p>
<p>To stake Ethereum we need a minimum of 32 ETH. This is because each validator requires 32 ETH to set up and for this same reason staking can only be done in increments of 32 ETH. For example, someone holding 320 ETH will have to set up 10 different validators. Anyone can take part in this consensus mechanism, all we have to do is run a validator (or ask to run it staking-as-a-service provider like P2P.org) and deposit 32 ETH to a special smart contract to activate a validator. This act is called staking.</p>
<h2 id="why-stake-ethereum-eth-with-p2p-a-namet2a">Why stake Ethereum (ETH) with P2P? <a name="T2"></a></h2>
<p>P2P has been running Ethereum validators since the launch of the Beacon Chain, in December 2020 as part of Lido Validator set. We take care of all the server maintenance and set-up.</p>
<p>P2P's Ethereum staking solution is completely non-custodial and each validator is personally set up so there is never any comingling of customer's funds throughout the process.</p>
<p>Those that choose to stake with P2P can also benefit from our insurance coverage against slashing events.</p>
<p>In short, the benefits are:</p>
<ul>
<li>High performance and uptime</li>
<li>Slashing insurance</li>
<li>Personal staking dashboard</li>
<li>Secure non-custodial staking</li>
<li>Experienced DevOps team</li>
<li>Part of the LIDO validator core set since inception</li>
<li>24/7 monitoring of machine and protocol metrics</li>
</ul>
<h2 id="what-does-the-ethereum-eth-staking-process-look-like-a-namet3a">What does the Ethereum (ETH) staking process look like? <a name="T3"></a></h2>
<p>To set up a validator we first need the following information:</p>
<ol>
<li>Specify the amount of stake - 1 validator per 32 ETH;</li>
<li>The withdrawal address.</li>
</ol>
<p>Please note that once set, the withdrawal address cannot be changed. A different address can also be specified to receive rewards.</p>
<p>Following the reception of this information, the validators are set up and a link to the deposit page will be sent out. This process can take up to 24 hours.</p>
<p>Once the staking deposit is sent, the validator will be created via our <a href="https://github.com/mixbytes/audits_public/tree/master/P2P.org?ref=p2p.org">audited immutable smart contract</a>. After a period of 16 to 24 hours, the validators will become active and start earning rewards.</p>
<p>Ethereum staking rewards are divided into 2 parts. Around 30% of the rewards can be withdrawn and are paid on a monthly basis while the rest is locked and can only be withdrawn after the Shanghai upgrade coming in 2023. Please note that this lock on rewards is not imposed by P2P but is a current feature of the Ethereum network.</p>
<p>Once the validators are up and running P2P will set up and email each staker a personalized dashboard that can be used to track rewards and validator metrics.</p>
<h2 id="ethereum-eth-staking-guide-a-namet4a">Ethereum (ETH) staking guide <a name="T4"></a></h2>
<ol>
<li>To start staking go to <a href="https://ethereum-staking.p2p.org/?ref=p2p.org">ethereum-staking.p2p.org</a> and click Stake now.</li>
</ol>
<p align="center">
<img src="https://p2p.org/economy/content/images/2023/01/Captura-de-ecr--2023-01-25-163236.png" alt="ETH staking">
</p>
<ol start="2">
<li>
<p>A new window will pop up and we can set how much ETH we want to stake and optionally a different withdrawal address. It's important to keep in mind that once the withdrawal address is set it can't be changed.</p>
<p>Here we can also set up an alternative wallet to receive MEV rewards. MEV rewards constitute around 30% of the APR and are paid on a monthly basis.</p>
</li>
</ol>
<p align="center">
<img src="https://p2p.org/economy/content/images/2023/01/Manual-stake---2-1.jpg">
</p>
<ol start="3">
<li>
<p>Once everything is set up, we can press continue and we will be taken to a confirmation screen. Here we have one last chance to change the withdrawal and the MEV reward address.</p>
<p>After reading and accepting the Ethereum Staking Terms and the Privacy policy we can continue.</p>
</li>
</ol>
<p align="center">
<img src="https://p2p.org/economy/content/images/2023/01/3.1.png" alt="ETH staking confirmation">
</p>
<ol start="4">
<li>A confirmation screen will pop up requesting that we check our email inbox to verify our email address. The reason why an email address is required is so that P2P can send out the URL to the staking page once the validator is set up.</li>
</ol>
<p align="center">
<img src="https://p2p.org/economy/content/images/2023/01/4.png" alt="ETH staking confirmation">
</p>
<ol start="5">
<li>Once the email address is verified the process of setting up a validator will begin. This process can take from 1 to 24 hours.</li>
</ol>
<p align="center">
<img src="https://p2p.org/economy/content/images/2023/01/5.png" alt="ETH staking cverify">
</p>
<ol start="6">
<li>
<p>After the validators are set we will receive a link to resume the staking process (this email should come from a @p2p.org domain). The next and final step is to deposit the ETH into the validators. To proceed click "Send deposits".</p>
<p>For clarification, the ETH is being deposited to the validators via a smart contract. This is the Ethereum equivalent of staking and is necessary to activate the validators.</p>
</li>
</ol>
<p align="center">
<img src="https://p2p.org/economy/content/images/2023/01/Aptos-letter-1.jpg" alt="ETH staking cverify">
</p>
<ol start="7">
<li>
<p>Next, we need to connect our Ethereum wallet.</p>
<p>This will be our personal staking page with a prepared staking transaction. What does it mean?</p>
</li>
</ol>
<ul>
<li>
<p>P2P has set up the validators</p>
</li>
<li>
<p>P2P has prepared a special deposit data file that contains information about the validators' addresses where the ETH will be deposited and the withdrawal address we have set up previously, to unstake in the future.</p>
<p>All of this information is available in the Deposit data file.</p>
</li>
</ul>
<p align="center">
<img src="https://p2p.org/economy/content/images/2023/01/2.jpg" alt="ETH staking cverify">
</p>
<ol start="8">
<li>
<p>We can stake with a Metamask or a Ledger wallet. There is currently no direct support for Trezor devices. We can stake with a Trezor wallet by first connecting it to a Metamask wallet.</p>
<p>Other wallets are also available but the process is more complicated. To use a different wallet please contact P2P via <a href="https://t.me/P2Pstaking?ref=p2p.org">Telegram</a>.</p>
</li>
</ol>
<p align="center">
<img src="https://p2p.org/economy/content/images/2023/01/3.jpg" alt="ETH staking cverify">
</p>
<ol start="9">
<li>
<p>After connecting the wallet we can set the gas price for our ETH transaction. When staking conventionally each validator would require an individual transaction but with a smart contract, we can stake up to 100 validators with a single transaction. This greatly reduces the cost of staking and the chance of human error.</p>
<p>Before signing the transaction we should once again check:</p>
</li>
</ol>
<ul>
<li>That the withdrawal address is set up correctly;</li>
<li>If the recipient address in the transaction matches P2P's deposit smart contract.</li>
</ul>
<p align="center">
<img src="https://p2p.org/economy/content/images/2023/01/5-1.jpg" alt="ETH staking cverify">
</p>
<ol start="10">
<li>After we set the fee we just need to sign the transaction and wait for it to be processed. Once the transaction is processed we are all done. It can take from 16 to 24 hours for the validators to become active. Once they are in the active set you will get access to a personal dashboard with information about your validator metrics.</li>
</ol>
<p align="center">
<img src="https://p2p.org/economy/content/images/2023/01/8.jpg" alt="ETH staking cverify">
</p>
<p>Those that stake Ethereum with P2P are encouraged to join a personal Telegram chat with some members of our team.</p>
<p>To note that while MEV rewards are paid on a monthly basis, 1 Validator only produces on average one block every 62 days. Those staking with only 1 validator should expect their first reward after 2 months. The more validators are staked, the sooner it will happen.</p>
<h2 id="p2p-ethereum-eth-staking-faq-a-namet5a">P2P Ethereum (ETH) Staking FAQ <a name="T5"></a></h2>
<h3 id="do-i-need-to-pass-kyc-to-stake-eth">Do I need to pass KYC to stake ETH?</h3>
<p>No, when working with P2P, there is no need to go through KYC because staked assets never touch our account and are sent directly to the Ethereum network.</p>
<h3 id="what-is-the-minimum-amount-of-ethereum-required-to-stake">What is the minimum amount of Ethereum required to stake?</h3>
<p>No Ethereum is necessary to run a node. However, it is necessary to stake 32 ETH x [amount of validators] to activate the validators and start getting rewards.</p>
<h3 id="what-is-a-withdrawal-address-and-who-owns-it">What is a withdrawal address, and who owns it?</h3>
<p>The withdrawal address is the Ethereum address used to unstake and receive rewards. This address is specified once and it can't be changed after the staking deposit is sent, because the network cements the association of a particular validator and withdrawal address. Access to the private key for this withdrawal address is required to unstake (seed phrase). It is also important to note that P2P is not a custodian and has no exposure to the client’s withdrawal private key. P2P will never ask, under any circumstance, at any time for access to the withdrawal key.</p>
<h3 id="what-is-a-validator-key-and-who-owns-it">What is a validator key, and who owns it?</h3>
<p>A validator key is a private key for maintaining the validator’s work (setting up validators, updating software etc.). P2P owns the validator keys and guarantees the highest standards for protecting these keys from being compromised, breached, or otherwise misused. This is accomplished through Threshold signatures, which are the gold standard for internal/external security threats. This solution is used by leading custodians, crypto banks, and Multi-Party Computation solutions.</p>
<h3 id="why-use-smart-contracts-to-stake-eth">Why use smart contracts to stake ETH?</h3>
<p>By design, ETH staking requires one staking transaction per 32 ETH. By using smart contracts we significantly simplify staking, reduce the cost of staking and minimize the risk of any human error. Thanks to our <a href="https://github.com/mixbytes/audits_public/tree/master/P2P.org?ref=p2p.org">audited</a> smart contracts it is possible to activate up to 100 validators with a single transaction.</p>
<h3 id="can-i-stake-ethereum-with-a-hardware-wallet">Can I stake Ethereum with a hardware wallet?</h3>
<p>Yes, it is possible to stake ETH with a Ledger (via native connection) or a Trezor wallet (via Metamask).</p>
<h3 id="how-do-i-earn-rewards-from-staking-ethereum">How do I earn rewards from staking Ethereum?</h3>
<p>Ethereum rewards are comprised of 2 parts associated with performing validation duties and block creation.</p>
<ol>
<li>Validation rewards are taken by performing the validator’s duties as an attestation for a block created by another validator, attestation for a block in sync committee and for creating a block. Validation rewards are accrued every 6.4 min and account for around 70% of the total rewards. Currently, these rewards aren’t withdrawable until the Shanghai upgrade. Following Shanghai, it will be possible to:</li>
</ol>
<ul>
<li>Fully withdraw all the staked ETH + rewards and deactivate the validator;</li>
<li>Partially withdraw all the Ethereum over 32 to the withdrawal address periodically.</li>
</ul>
<ol start="2">
<li>Block rewards (priority transaction fees + an additional fee from MEV) are accrued with block creation as a payment from transactions to the validator for including them in the block. It appears once every 62 days on average and accounts for around 30% of the total reward. MEV-boost isn’t a separate type of reward but is a technique used to build a block that will yield the maximum fee. Transaction fees accumulate on a p2p smart contract which is then automatically delivered to the client on a monthly basis after the P2P service fee has been deducted.</li>
</ol>
<h3 id="can-i-still-use-my-staked-ethereum-while-it-is-staked">Can I still use my staked Ethereum while it is staked?</h3>
<p>No, the staked ETH is locked in the Ethereum smart contract and cannot be used.</p>
<h3 id="how-does-p2p-take-its-service-fee">How does P2P take its service fee?</h3>
<p>P2P takes its service fee from the execution layer rewards. By default, a special immutable smart contract is used to automatically split rewards between the user and P2P by the previously agreed rules. Other invoicing strategies can be employed by prior agreement.</p>
<h3 id="how-do-i-unstake-my-ethereum">How do I unstake my Ethereum?</h3>
<p>Unstaking will be available after the Shanghai upgrade, which is planned for March 2023. The ustaking time is projected to be 2-3 days depending on the number of validators that want to exit. This process consists of four steps:</p>
<ol>
<li>There will be an unstaking page, where it is possible to authorize the unstaking process with the withdrawal address via the click of a button.</li>
<li>P2P sends the validator a voluntary exit message to the Ethereum network, and your validators move into the exit queue. The validator then ceases participating in block attestation and creation (and stops getting rewards). The exit can take from 16 to 24 hours, but right after Shanghai, this queue may be much longer.</li>
<li>After exit, the validator waits 27 hours as the network wants to ensure that it hasn't been slashed.</li>
<li>Finally, the validator is moved into the second and final queue. This time, the validator is totally deleted from the network and returns its ETH with consensus layer rewards. This process can take from 16 to 24 hours.</li>
</ol>
<h3 id="how-does-slashing-work-in-ethereum">How does slashing work in Ethereum?</h3>
<p>Slashing punishes validators for actions that are very difficult to do accidentally, and it’s very likely a sign of malicious intent. It’s a really rare event: there's only been 5 slashed validators within the whole network over the last month (or 0.001%). <a href="https://beaconcha.in/validators/slashings?ref=p2p.org">beaconcha.in/validators/slashings</a></p>
<p>What is “slashable” behaviour? In a nutshell, it’s a violation of consensus rules in the network. As of right now, it needs to meet three conditions: proposal of two conflicting blocks at the same time, double vote attestation and surround attestation. This can happen due to either an intentional malicious action or misconfiguration of the validator (the most often being, running two of the same validators in the network).</p>
<p>Slashing results in burning 1,0 ETH at once, and removing the validator from the network forever, which takes 36 days. During this time, the validator continues to work but can no longer participate in validation and block creation, getting a penalty of around 0.1 ETH in total.</p>
<p>For the most part that's the sum of the penalty incurred, but there is also an additional midpoint (Day 18) penalty that scales with the number of slashed validators. This is called "correlation penalty” and it's currently only theoretical and has never been encountered on the Ethereum mainnet. This mechanism is there to protect the network from large attacks. The math for calculation penalty is pretty complicated, but the summary is if there are only 1, 100, or even 1000 slashed validators within 36 days the penalty will equal zero ETH. However, if the number of slashed validators increases to roughly 1.1% of all validators (currently 5.1k), this penalty becomes 1 ETH and an additional 1 ETH for every additional 1.1% validator slashed. So if 1/3 of the network is slashed, the penalty will nullify the whole stake (32 ETH). This mechanism is in place to prevent an attack on the network and it should never be triggered by accident.</p>
<h3 id="how-can-slashing-be-prevented">How can slashing be prevented?</h3>
<p>There are special mechanisms in place to prevent validators from meeting the slashing conditions called <a href="https://medium.com/prysmatic-labs/eth2-slashing-prevention-tips-f6faa5025f50?ref=p2p.org">slashing protection</a>. These mechanisms usually consist of a database with a signing history which the validator uses to check if the block can be signed (coupled with the default levels of monitoring and alerting protection). Additional protection levels will depend on the validator’s setup. P2P uses double-checking with a separate database at the key-manager stage and secures validators' key’s by Threshold, which means that no single person, even a P2P engineer, can run a second validator and a quorum is required for that. The final level of protection we have in place is an institutional grade slashing insurance.</p>
<h3 id="how-can-staking-activity-be-tracked">How can staking activity be tracked?</h3>
<p>Anyone who stakes with P2P gets access to a personal staking dashboard that can be used to track rewards and the validators' performance (APR, staking balance, % of blocks created with MEV, attestation rate, missed block, market comparisons, etc.)</p>
<h3 id="in-what-geographic-location-is-p2ps-validator-infrastructure-running">In what geographic location is P2P's validator infrastructure running?</h3>
<p>P2P direct staking infrastructure is located in Europe and distributed among 5 separate physical locations for protection from downtime.</p>
<h3 id="how-does-p2p-protect-its-validators-from-widespread-outages">How does P2P protect its validators from widespread outages?</h3>
<p>P2P validators have no single point of failure and are downtime resistant with back-ups of all critical infrastructure parts between 5 different physical locations, including:</p>
<ol>
<li>
<p>Signing infrastructure - 3 location-independent key managers with 2-of-3 threshold quorum required for consensus;</p>
</li>
<li>
<p>Validators Nodes - we have a reserve in a secure region ready to be activated within a maximum of 1 minute in case of an outage;</p>
</li>
<li>
<p>Consensus layer nodes - our setup has top-3 consensus layer clients (Lighthouse, Prysm, Teku) simultaneously for diversity and preventing outrages related to soft bugs in one client. It also increases availability for validators.</p>
</li>
</ol>
<!--kg-card-end: markdown-->
<h3 id="the-graph-overview">The Graph overview</h3><p>The Graph is a decentralised protocol for querying and indexing data from blockchains. It is the backbone of major crypto projects like Uniswap, Lido, Livepeer and Decentraland. Basically, any dApp in order to be truly decentralised has to store its data on a distributed database. And The Graph is where dApps can store and collect information in a familiar Web 2.0 fashion but with Web3 security and reliability.</p><p>You can capitalise on major Web3 projects’ successes and failures and earn fees on The Graph platform. The Graph supplies the databases and computing powers to support these projects and this work is done by the <strong>indexers<em>.</em></strong> This work is backed by <strong><em>delegators</em></strong> that stake GRT by delegating it to them. Anyone can become a delegator and get between 9% and 15% APY on their GRT tokens.</p><p>Those looking for a <strong>higher yield and comfortable with higher risks</strong> can consider becoming a <strong>curator</strong>. </p><h3 id="how-to-become-a-curator-and-earn-up-to-30-apr-on-the-graph">How to become a curator and earn up to 30% APR on The Graph</h3><p>A Curators’ job is to identify the most prosperous Web3 projects that use The Graph as their database and <strong>buy their shares</strong>. When a curator holds these shares they get a part of the query fees served by indexers with some of them returning <strong>up to 30% APY</strong>. </p><p>With the new dashboard made by P2P for curators, it has become easier than ever to make data-driven decisions.</p><p><a href="https://reports.p2p.org/superset/dashboard/graph_curation?ref=p2p.org">https://reports.p2p.org/superset/dashboard/graph_curation</a></p><figure class="kg-card kg-image-card"><img src="https://lh4.googleusercontent.com/LWEFh4gxRK4CE8sSXkllZBvzy36YjMQi451EtVbXDWa3eHQR8s8UczlTY6Tbmq5_fJ1oJae4keRPkUWjlb8P_JJfEnjdo6N19XL0KdeABpsAIj1u5rJk4KV8_zE1_rZRcvwvFdenPU9_bAQNkbGsHGrjvABnpwgb8rjVSo5goYyZc4ic6ZUaTBXnc2BwfA" class="kg-image" alt loading="lazy" width="602" height="197"></figure><p>The first tab (subgraphs) is designed to give you data on where the upcoming query fees are going to be higher. </p><p>The creators’ share column would help you identify how many other curators may leave and thus lower your share price, as it is unlikely (but still possible!) for subgraph creators to abandon their own subgraph.</p><p><strong>Query fees (QF)</strong> probability is calculated based on the past 30 days. If there were no queries in the last month, the probability of new queries is close to 0. The percentage takes into account all closed allocations, their size, and duration and estimates the probability of the next query.</p><p><strong>QF APR</strong> is estimated based on the annualised Price per Share changes <strong>in the last 30 days </strong>based on indexers' allocation collect events.</p><p><strong>QF APR If You Signal N GRT</strong> is calculated considering current signals & query fees collected in the last 30 days.</p><figure class="kg-card kg-image-card"><img src="https://lh4.googleusercontent.com/fPz7MeZb9VYyYw_iuPEagHOUkDL8YfaTa9lYmumMy2HQ0Uj9Tr87iApkHN2rS1z6WBC28LpmrQO9dvUGWpBNVZ-YO76Z4V3uKPA65sTplIWK_Of07bnIRIPEJv1QdEBWVNGGLj_JMNDdnxyR-k-5qblJEHdGDyMNhpvj4bBJyGbh_5Iafk99X34fyjPU9g" class="kg-image" alt loading="lazy"></figure><h3 id="how-are-query-fees-accrued">How are query fees accrued</h3><p>Everything starts with indexers allocating their GRT to subgraphs. They would allocate their tokens proportionally to the number of signals on the subgraphs. </p><p>In the table below Proportion = Signals / Allocated GRT</p><!--kg-card-begin: html--><p align="center">
<img src="https://p2p.org/economy/content/images/2022/12/image.png">
</p><!--kg-card-end: html--><p>If for example, curators added signals to the UMA subgraph, this would in theory lead to more indexers allocating GRT there. An allocation generates rewards for a period of 28 epochs only (approx. 28 days). After that, the allocation stops generating rewards and indexers have an incentive to close them. They may also close their allocation earlier if the signals on the subgraphs change. You can observe indexers' behaviour towards particular subgraphs in the Selected Subgraphs’ Current Indexers’ Allocations table.</p><figure class="kg-card kg-image-card"><img src="https://lh5.googleusercontent.com/A2KQHjzfMubFzSf3ZibEnHuYz0GCsRrsTNU5ygynfA_13tZzoOMiWI9ejdvDeqpfG7rO3u4rXDkeWQdWRBkPcDFdlb16_Oo_Hi4dQskoZRBl_mOJZXj7Qxakft6kF4KjlJ2X26jzZuBSWsllv9WqHq0s3r0VNB8MR9SpZjMKpV2bmuqL1lwDzBOnGLzV9A" class="kg-image" alt loading="lazy" width="602" height="99"></figure><p>Here's how the allocation lifecycle plays out:</p><figure class="kg-card kg-image-card"><img src="https://p2p.org/economy/content/images/2022/12/image-1.png" class="kg-image" alt loading="lazy" width="647" height="133" srcset="https://p2p.org/economy/content/images/size/w600/2022/12/image-1.png 600w, https://p2p.org/economy/content/images/2022/12/image-1.png 647w"></figure><p>Because Indexers have to pay gas for every action sometimes they choose not to collect query fees if the reward doesn't outweigh the cost. They can store those query fees and accumulate them until it is economically viable to claim them. To help you predict whether an indexer will claim query fees, we provide you with the stats for previous allocations. Curators only get their share of query fees after the indexers claim them.</p><h3 id="differences-between-the-share-price-and-the-token-price">Differences between the share price and the token price</h3><p>Query fees are not the primary source of income for curators. Most of the tokens earned come from the <strong><em>shares' price changes</em></strong>.</p><p>The share price is not tied to the project’s token price. For example, changes in the Uniswap token price, UNI, do not correlate with changes in price for its subgraph shares. Some of the projects with a subgraph do not have a token at all, for example, Connext has not released its token yet. You also need to pay attention to the subgraph publisher. For example, Messari has published subgraphs for Uniswap, Lido and other projects, but those subgraphs are not used by Uniswap or Lido, but by Messari.</p><p>With the help of our new tools, you can take a look at how other curators earn GRT on the share price changes. You can try to figure out the tactics that others use to become more profitable by taking a look at their portfolio and the actions they took.</p><h3 id="shares-price-and-bonding-curve">Shares price and bonding curve</h3><p>When signalling onto the subgraph a curator buys shares. The price of a share is pre-determined by the bonding curve and each subsequent share is more expensive. The same logic applies in the opposite direction. If someone sells a share, the share price of each curator on that subgraph drops as the price goes down the bonding curve. This process is well documented in <a href="https://thegraph.com/docs/en/network/curating/?ref=p2p.org">The Graph's official documentation</a>. The primary way to earn rewards in curation is by being among the first to notice the true potential of a subgraph.</p><p>There are a few tactics that can be applied to be successful in this way of earning rewards. One that is very frowned upon by the community is the use of front-running bots that signal on a subgraph as soon as it appears in the network. There are different proposals on how to decrease their impact on the industry. These bots are not as aggressive as in other parts of the crypto ecosystem, so they still leave an opportunity for common investors to earn rewards in the curation market.</p><p>Projects with big names, such as Lido, Messari, and Curve get their signals very quickly as it is assumed that they will generate both hype and query fees that would generate rewards. But keep in mind that anyone can create a subgraph with any name, so it is better to make sure that the subgraph you plan to signal on is the official one. In all the cases mentioned above, a good place to discuss any Curation related questions is the official <a href="https://discord.com/invite/vtvv7FP?ref=p2p.org">discord channel</a>.</p><p>We hope our new tool helps you in your curation process decision-making, or if it is the case, it helps you get started. We are always happy to hear your feedback on the work we are doing, so do not hesitate to reach out, and make suggestions on how we can make The Graph even better.</p><p>Check out the tool below.</p><figure class="kg-card kg-bookmark-card"><a class="kg-bookmark-container" href="https://reports.p2p.org/superset/dashboard/graph_curation/?ref=p2p.org"><div class="kg-bookmark-content"><div class="kg-bookmark-title">Superset</div><div class="kg-bookmark-description"></div><div class="kg-bookmark-metadata"><img class="kg-bookmark-icon" src="https://reports.p2p.org/static/assets/images/favicon.png" alt=""></div></div><div class="kg-bookmark-thumbnail"><img src="https://reports.p2p.org/static/assets/images/loading.gif" alt=""></div></a></figure><hr><h2 id="about-p2p-validator"><strong>About P2P Validator</strong></h2><p><a href="https://p2p.org/?utm_source=blog&utm_medium=economy&utm_campaign=cosmos_fee">P2P Validator</a> is a world-leading non-custodial staking provider with the best industry practices and proven expertise. At the time of publishing, P2P Validator is trusted with over $1B in staked assets by over 30,000 delegators across 40+ networks.</p>
 ALL
Agoric
Aptos
Auth
Avail
Avalanche
Axelar
Babylon
Bitcoin
BTC
capital flow
Cardano
Celestia
certifications
Chainlink
compliance
Cosmos
Crescent
curator
Cyberway
DAOBet
Data stream
DeFi
defi dispatch
defi infrastrcuture
defi infrastructure
defi news
defi vault
due diligence
DVT
Dymension
Economy
Education
EigenLayer
Elrond
employee
employee advocacy
employee interviews
Ethereum
Evmos
exit queue
Explain Like I'm Five
Governance
Guide
hedge fund
how to
HR
HUB series
Hyperliquid
infrastructure
institutional lens
Kava
Kusama
landing
legal layer
Lido
liquid staking
LSP
Manta
Mantle
Marlin
Matic
MiCA
Moonbeam
MultiversX
Near
Networks
News
NuCypher
Oasis
Obol
Origin
P2P Verified
Partnership
pectra
Persistence
playbook
Pocket
Polkadot
Polygon
product
products
Quicksilver
Regen
regulation
Renzo
restaking
RPC Node
Sender
Serum
slashing
Solana
SSV
SSV.Network
ALL
Agoric
Aptos
Auth
Avail
Avalanche
Axelar
Babylon
Bitcoin
BTC
capital flow
Cardano
Celestia
certifications
Chainlink
compliance
Cosmos
Crescent
curator
Cyberway
DAOBet
Data stream
DeFi
defi dispatch
defi infrastrcuture
defi infrastructure
defi news
defi vault
due diligence
DVT
Dymension
Economy
Education
EigenLayer
Elrond
employee
employee advocacy
employee interviews
Ethereum
Evmos
exit queue
Explain Like I'm Five
Governance
Guide
hedge fund
how to
HR
HUB series
Hyperliquid
infrastructure
institutional lens
Kava
Kusama
landing
legal layer
Lido
liquid staking
LSP
Manta
Mantle
Marlin
Matic
MiCA
Moonbeam
MultiversX
Near
Networks
News
NuCypher
Oasis
Obol
Origin
P2P Verified
Partnership
pectra
Persistence
playbook
Pocket
Polkadot
Polygon
product
products
Quicksilver
Regen
regulation
Renzo
restaking
RPC Node
Sender
Serum
slashing
Solana
SSV
SSV.Network